Abstraction
The notion of “text” was described using a variety of abstractions (e.g., paragraphs, sentences, etc.), but suffers as an example because each of these “levels” of abstraction are visible at once to many experienced readers.
Consider this image as another example.

What is an image? To a human without a visual impairment, an image on a computer screen might be a representation of items or a scene in the real world. But what is an “image” from a computing perspective (though, in some computing contexts, identifying an image in the same manner as a human is the ideal)?
An Image as Numbers
One representation of an image within computing is as a sequence of “pixels”. Each pixel is a triple (group of three) of numbers representing color components. For instance, an “orangish” color might be represented by the triple:
202 106 53
Each number represents a color component—red, green, and blue, in that order—for the given pixel.
Consider:
The following block of numbers represents the first 30 pixels in the image below. The first three lines specify attributes of the image like its dimensions (size). The remaining lines describe the pixels in the image, starting at the top-left of the image and moving to the right. Each pixel describes a tiny portion of the sky in the image that you see (notice that they all have a bit more blue than the other colors).
P3
761 192
255
125 165 227   129 168 237   126 163 233   126 165 232   122 163 227
123 167 232   124 164 233   126 165 234   123 167 232   121 165 230
123 164 230   125 164 231   125 164 231   126 165 232   126 165 232
125 164 231   126 165 232   126 165 232   126 165 232   126 165 232
126 165 232   126 165 232   124 165 231   124 165 231   124 165 231
124 165 231   124 165 231   123 164 230   124 165 231   125 166 232
...
Could we then say that an “image” is just a bunch of numbers? Yes. But is this a useful perspective? Sometimes it is.
Processing pixels (an image?)
When considering an image as a whole, then operations such as saving, loading, and displaying the image are meaningful without regard to the detailed representation described above. We can even reason about operations like scaling (resizing) and rotating (such as when using an image editing program) without considering the details of the representation.
So then, when might this more detailed representation of an image be useful? Precisely when one wishes to implement one of the more abstract operations just mentioned. Though there are programs or apps to scale, rotate, and apply filters to images, these “large” operations (algorithms, if you will) are not directly supported by computers. Instead, somebody must write code to manipulate the more detailed representation. In those cases, the detailed representation becomes crucial for implementing the desired functionality.
A Filter Example
The following is the same image after applying some filter to make the image “pop” (presented in both visual form and detailed pixel form). You can compare the pixel values below with those above; for instance, the first pixel is a little more red, a little more green, and a little more blue than it was. (Though it just so happens that the second pixel, under this filter, remained unchanged.)

P3
761 192
255
127 167 229   129 168 237   129 166 236   127 166 233   126 167 231
124 168 233   126 166 235   128 167 236   125 169 234   124 168 233
125 166 232   127 166 233   127 166 233   128 167 234   128 167 234
127 166 233   128 167 234   128 167 234   128 167 234   128 167 234
128 167 234   128 167 234   126 167 233   125 166 232   126 167 233
126 167 233   125 166 232   123 164 230   125 166 232   127 168 234
...
Composition
Composition makes explicit an association or grouping of data into a whole.
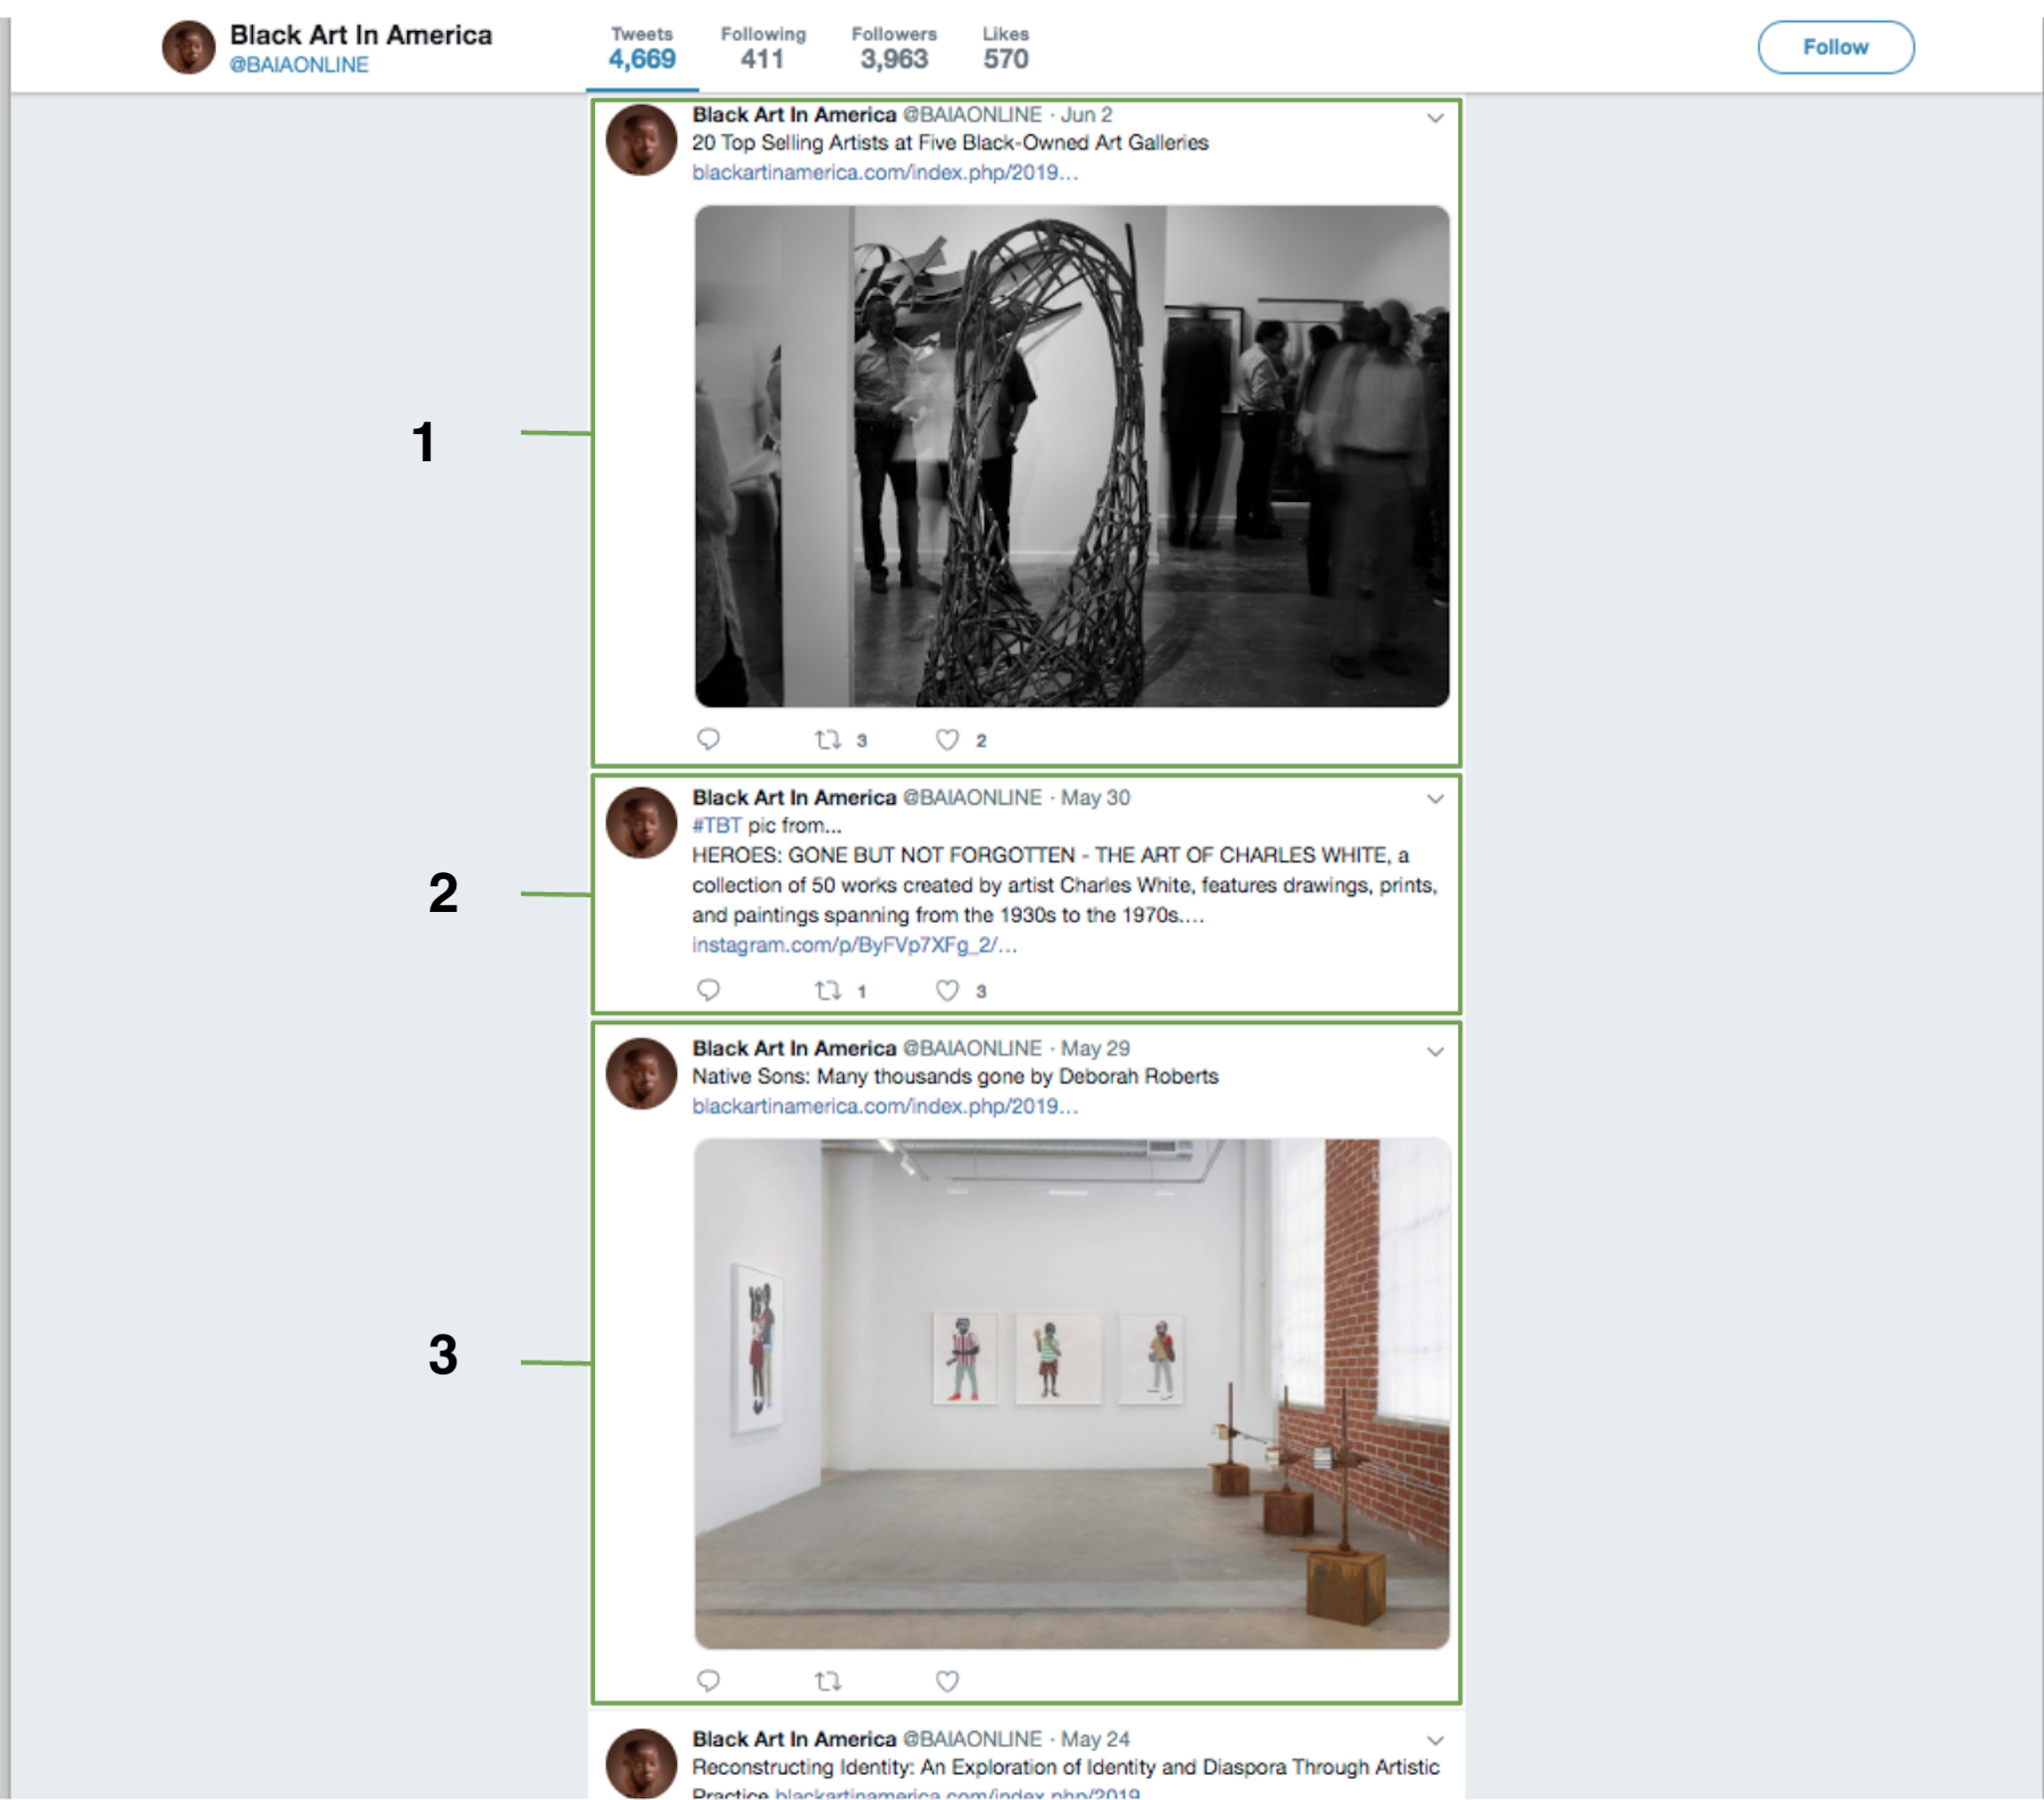
Consider the webpage in this image. It contains a great amount and variety of data, including the “banner” for each tweet, such as the user name, the user identifier, the numbers of tweets, followers, and likes, etc. Within each tweet itself we can see similar data as well as images, text, dates, links, and data associated with retweets, likes, and comments (not all of this data is visible).

You may have noticed that each individual tweet generally follows the same structure in that each contains, in general, the same sorts of data (e.g., user identification, date, text/images/links, retweets, etc.). How many tweets do you see in this image (ignoring the partial tweet at the bottom)?
When discussing such a page, one is most likely to speak in terms of full tweets instead of the individual pieces of data that make up the tweet. For example, “there are three tweets highlighted in the following image” rather than three dates, three user ids, three …
It is often much simpler to reason about a whole rather than its parts. This is similar to how abstractions allow one to reason about or refer to more abstract representations (e.g., images) rather than detailed representations (e.g., pixels).
Collections of Compound Data
In the image above, the collection of tweets can itself be considered as a whole. Though there are only three tweets highlighted in this image, there are more tweets preceding and following those shown. We can describe such a collection, wherein the ordering is significant, as a sequence or a list.
As such, one might consider the primary content on this website as a list of tweets (ordered by date) where each tweet is a composition of user name, user id, date, text, etc.
Compound data
If one looks a bit closer at each tweet it is apparent that the comments, retweets, and likes are not just numbers despite what is shown in the screenshot. Looking more closely at each tweet reveals further depths to the data it represents.
What is the data within a comment? What is the collection of comments? A comment is a composition of data that represents who is commenting, when they commented, and what they said. The collection of comments is likely a list as well (perhaps ordered by date or, in some applications, popularity).
What is the data within a “like”? What is the collection of likes? Is the order of likes significant? Since a user can only like a tweet a single time (and can revoke that like), the data representing a single like must track that user’s information. But the order of the likes is not generally significant.
What is missing?
We can “see” a lot of data in these tweets, but is that all of the data used to generate this webpage and to dictate interactions with it?
Consider the following and the sorts of data that one might need to answer these questions.
- Who can see these tweets?
- Is privacy information part of the tweet composition (allowing control for each individual tweet) or part of the account information? Or both?
- Should a newly approved follower have access to all tweets prior to their approval?
- Who can use the information in a tweet?
- Who can view the comments?
- Who can see the set of users that “like” a tweet? Should liking a tweet be a public declaration? Does the person issuing the “like” have control over this?